
Custom Datasets
Create personalized reports that filter or exclude specific payees, categories, notes, accounts, tags, etc.
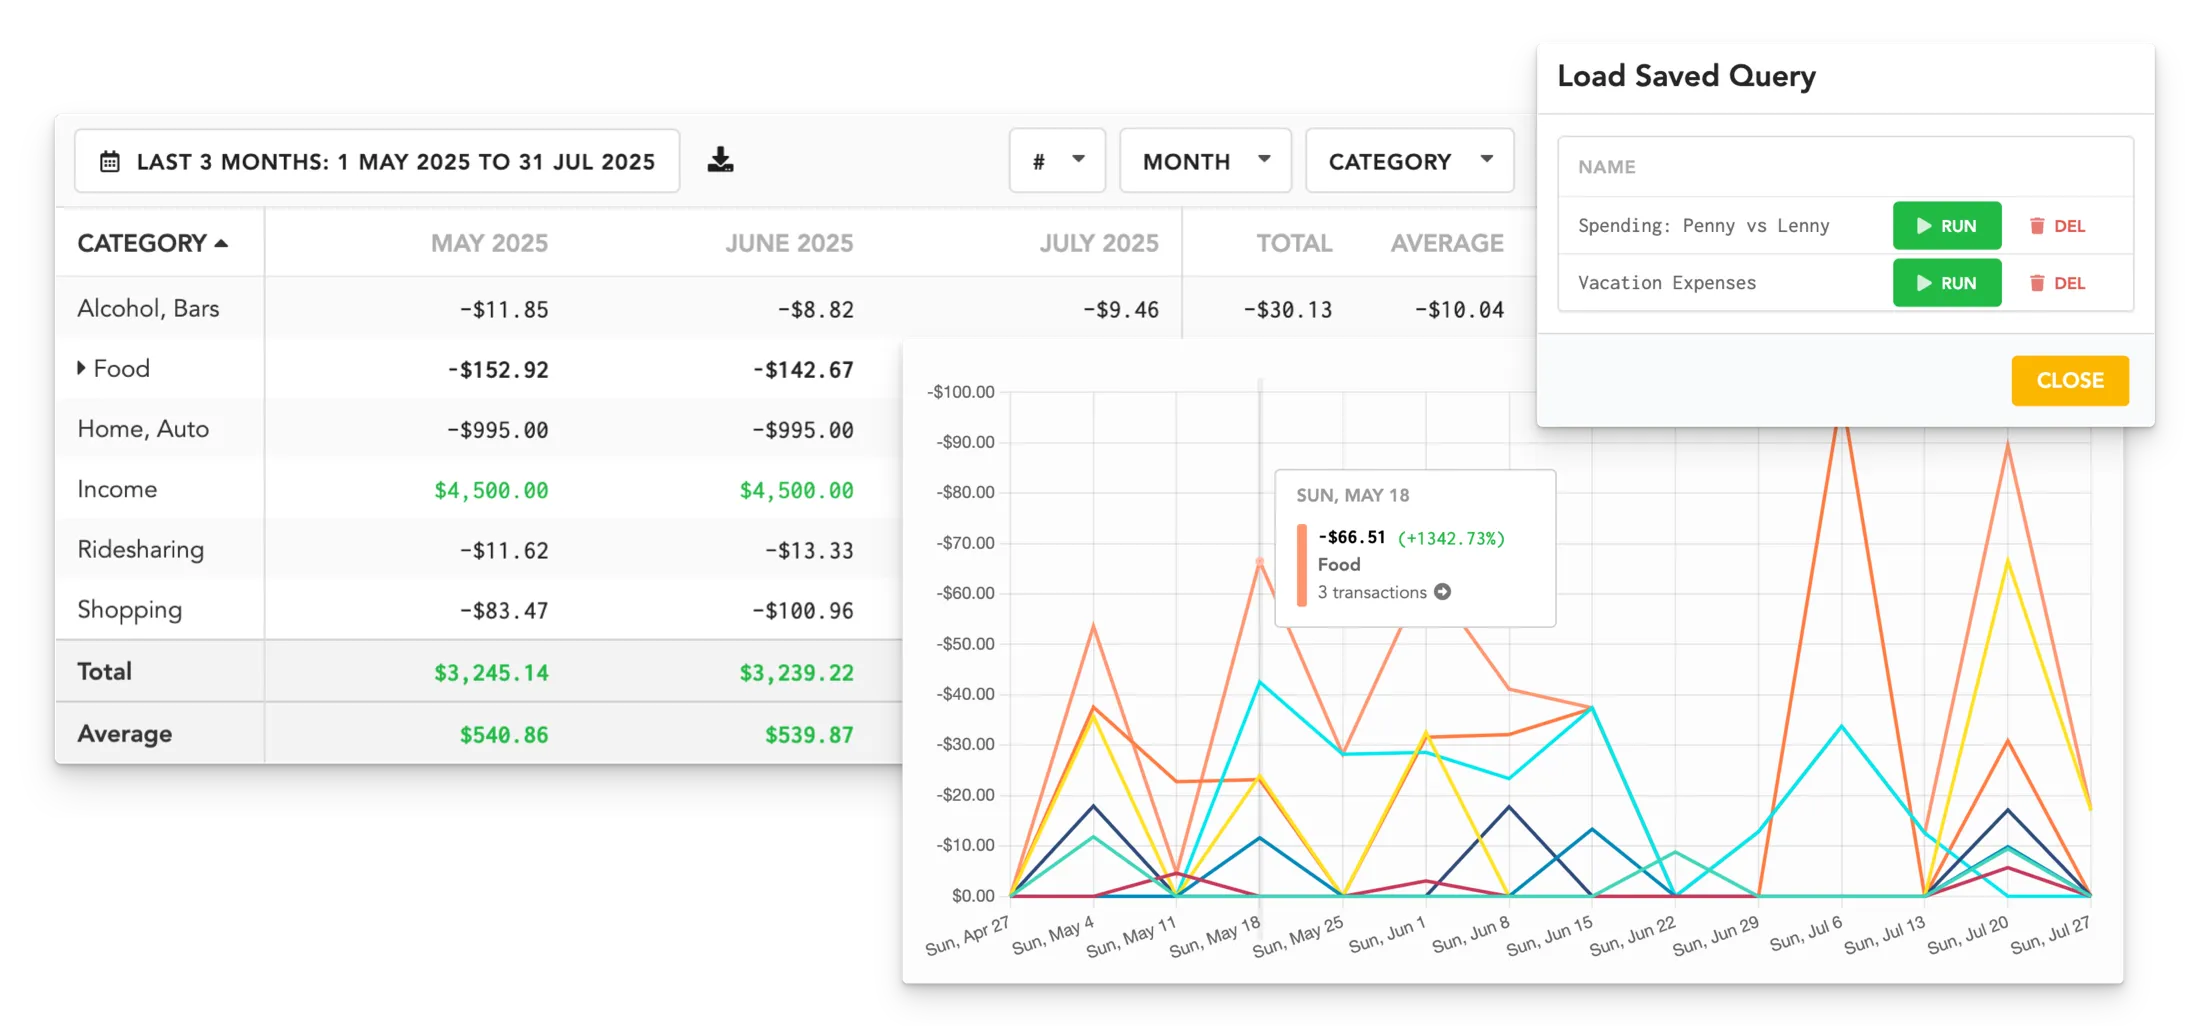
Saved Configurations
Create once, use forever! Save your frequently used custom setups, then load them in just two clicks!
Tabular Report
View, sort, and filter your data in an easy-to-read table format that includes totals, averages, and transaction counts.
Export to CSV
With one click, download your report as a CSV spreadsheet, including totals, averages, and counts.
Graphs & Charts
Visualize your data with color-coded charts that fit your style, whether it’s a pie chart, bar graph, line chart, or a stacked bar graph!
Advanced Filtering
Focus on what matters. Set your time period and filter or exclude specific categories, accounts, tags, payee names, or recurring items.
FAQs
Are there any predefined insights available?
Don’t want to create your own reports? The Stats and Trends pages display clear patterns of your spending habits, presented in easy-to-read, color-coded graphs and visualizations. These include:
- Top Expensive Purchases
- New Merchants
- Top Merchants by Total Cost
- Top Categories by # of Transactions
- Total Transactions this period
- Total Expenses tracked this period
- Savings Rate
- Highest Expenses per month
- ..and more!


